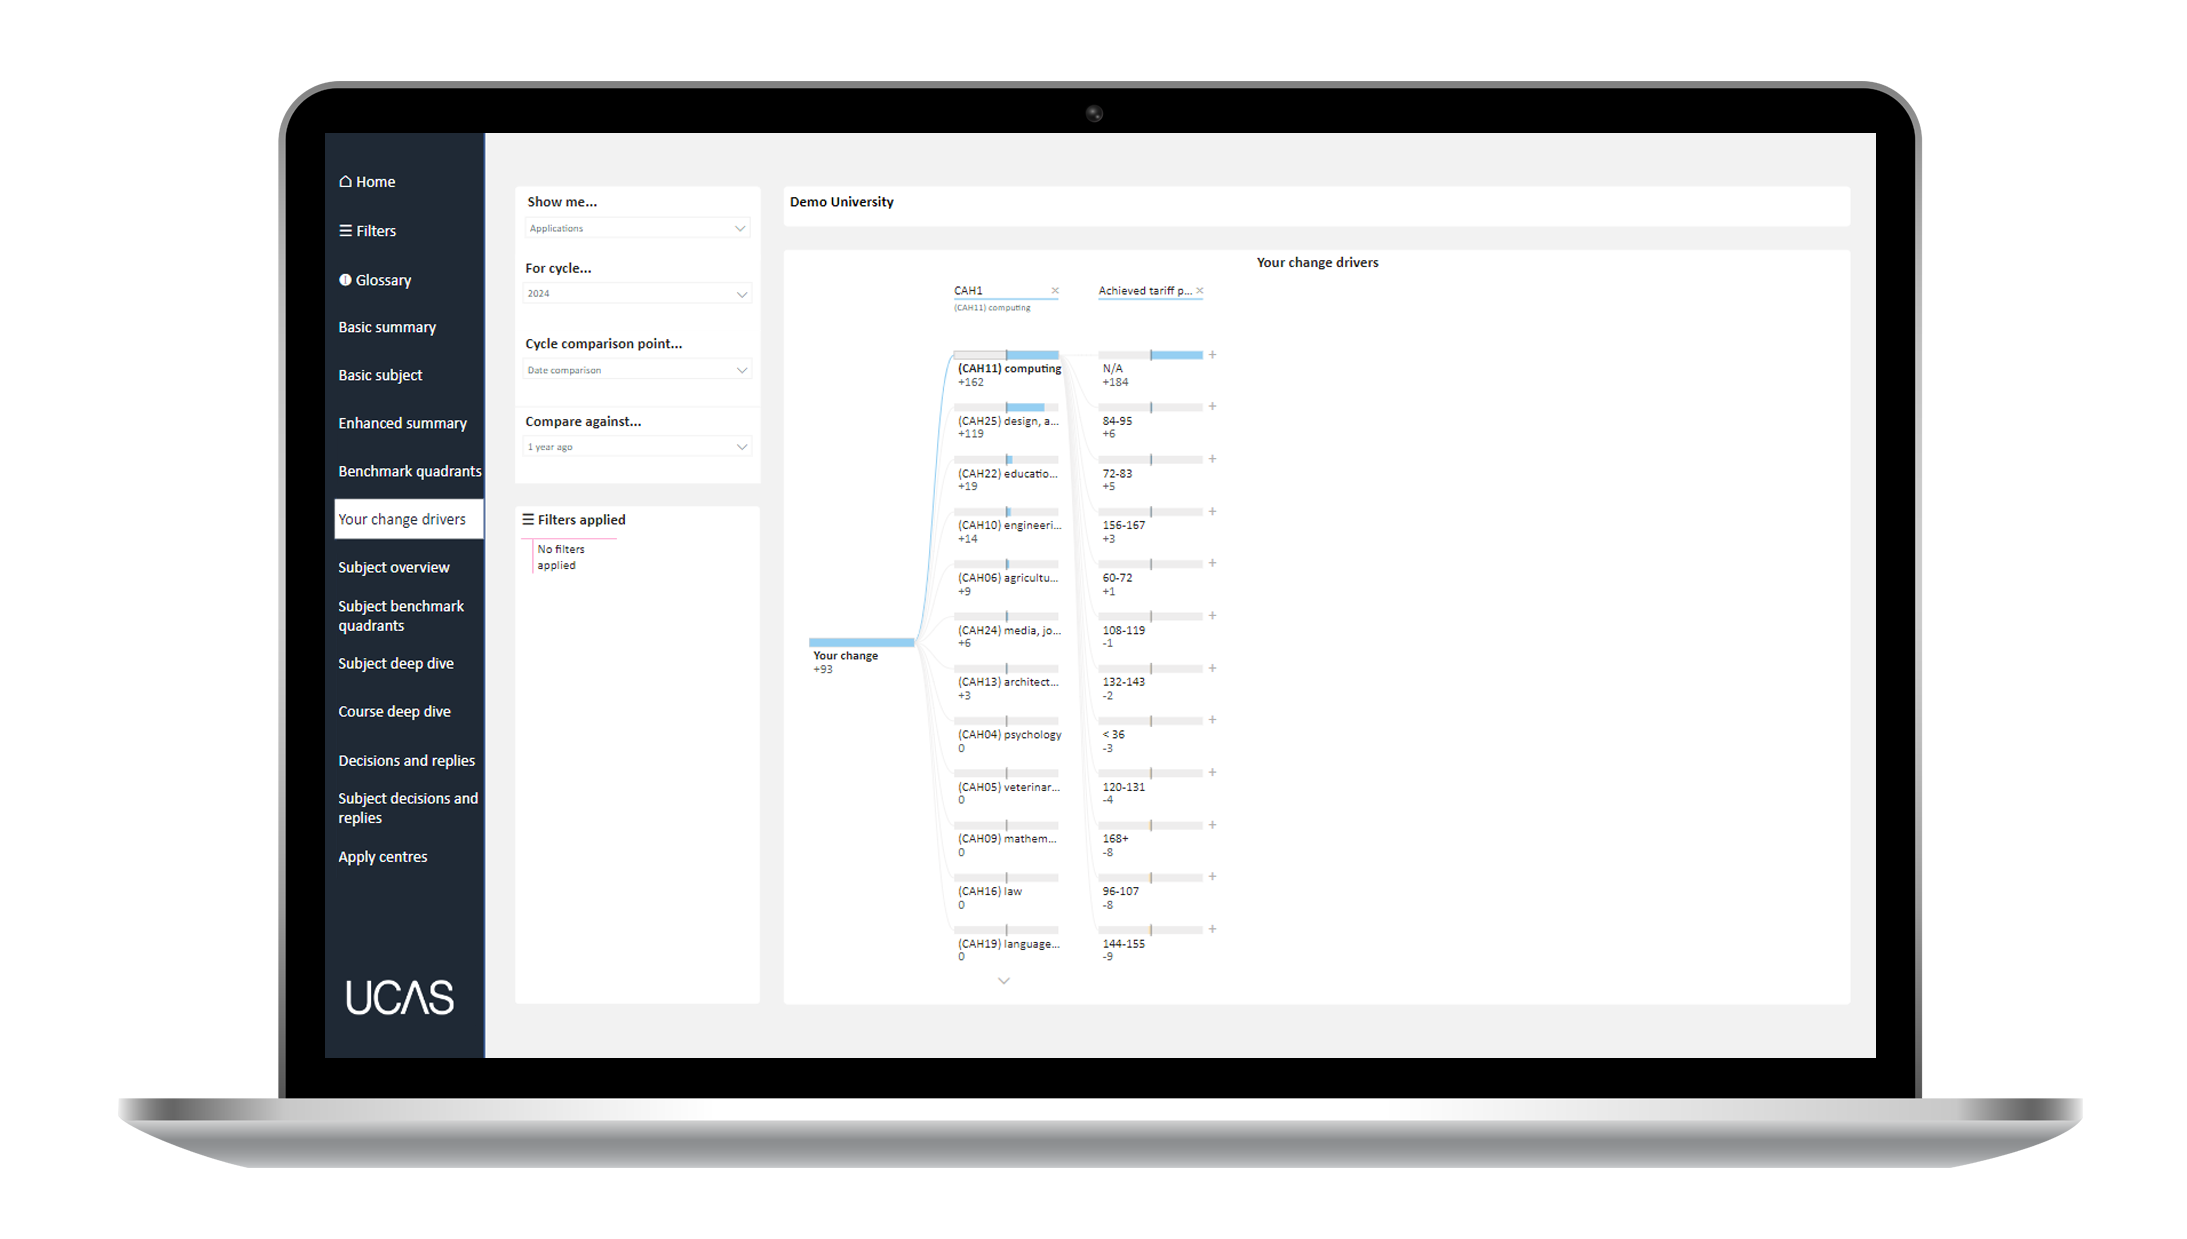
Your Change Drivers
Explore Change Drivers in the UCAS Tracker
< Back to UCAS Tracker guide
Your Change Drivers
This page begins to answer the question of “Why is change happening?” – both positively and negatively.
How does it work?
The Change Drivers visualisation is an AI based tool that conducts a root cause analysis of the change in your own numbers. It provides a picture of how varied factors relating to your applicants’ profile and subject choices, are impacting each other.
By pressing the (+) sign next to their numbers and selecting high or low value, Power BI uses artificial intelligence to analyse all the categories available and will show your most significant areas with gains or losses (based on whether you chose high or low value respectively).
Use this page to:
- Help you identify what factors are driving the change in your numbers, focussing on indicators of candidate quality, domicile (inc. drive time) and age group.

Top Tips for Change Drivers
Variable impact display
Once you’ve added all the demographic variables to your visualisation, you can click on any single option (e.g. a different subject, or a different age group) and the whole chart will adjust itself to show you impact on the variable you just chose.